![Rock Abrasion Tool (RAT) overview. (a) Side view of RAT housing. (b) End-on view of RAT showing cutting heads on grinding “paddle wheel.” Outer butterfly ring (diameter 8.5 cm) aids RAT place- ment against target rock. (c) Schematic diagram indicating paddle wheel motion through abraded region (from Myrick et al. [2004]).](http://lunatic.utk.edu/wp-content/uploads/2017/10/01_Fig01_RAT_views-650x479-300x221.jpg)
Rock Abrasion Tool (RAT) overview. (a) Side view of RAT housing. (b) End-on view of RAT showing cutting heads on grinding “paddle wheel.” Outer butterfly ring (diameter 8.5 cm) aids RAT placement against target rock. (c) Schematic diagram indicating paddle wheel motion through abraded region (from Myrick et al. [2004]).
Physical Properties of Surface Materials
A topic of long-standing interest of mine is understanding the physical properties of planetary surface materials, such as the strength, density, and texture of rocks. On Earth, a geologist in the field can tap their hammer against rocks to determine which are fresh and which are weathered depending on if the hammer responds with a “ping” or a “thud,” respectively. In an analogous manner, I have used robotic arm measurements to infer the density of rocks at the Viking 2 Lander site [Thomson et al., 2008], and grind motor currents to infer the strength and weathering state of rocks at the Mars Exploration Rover Spirit site in Gusev crater [Thomson et al., 2013, 2014].
I have co-authored two chapters in a book about extraterrestrial drilling [Han et al., 2009; Zacny et al., 2009], and am involved in projects examining drill core from acid saline lakes in Australia [Baldridge et al., 2014] and deep-sea drill core collected by the Integrated Ocean Discovery Project [McCanta et al., 2015].
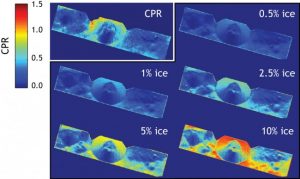
Mini-RF data from 2010-04-18 of Shackleton crater (Mini-RF swath LSZ_03737_2CD_OKU_90S137_V1). Upper left panel is measured CPR data; other panels show synthetic CPR values calculated using a semi-empirical model of an ice-silicate mixture. Ice contents of 0.5, 1.0, 2.5, 5, and 10 wt% H2O ice are given.
Radar investigations
While working at the Johns Hopkins University Applied Physics Laboratory, I was fortunate to have the opportunity to be a member of the science teams for the Mini-SAR and Mini-RF radar instruments. The radars flew on the ISRO’s Chandrayaan-1 (Mini-SAR) and NASA’s Lunar Reconnaissance Orbiter (Mini-RF). Working with colleagues, we investigated potential ice deposits in the polar regions of the Moon [Spudis et al., 2010, 2013; Neish et al., 2011; Thomson et al., 2012]. In addition, we used the distinctive radar signature of impact craters to help constrain their age and better understand the evolution of the lunar regolith [Bell et al., 2012; Thomson et al., 2013; Fassett et al., 2018; Heggy et al., 2020].
![Crater count data to help establish age of Gale crater central mound. (C) CTX mosaic of layered mound showing craters mapped on Gale crater floor. (D) HiRISE, CTX, and THEMIS daytime IR images of Gale floor units showing impact craters identified with filled circles. Figure from Thomson et al. [2011].](http://lunatic.utk.edu/wp-content/uploads/2017/10/03_gale_floor_count-650x337-300x156.jpg)
Crater count data to help establish age of Gale crater central mound. (C) CTX mosaic of layered mound showing craters mapped on Gale crater floor. (D) HiRISE, CTX, and THEMIS daytime IR images of Gale floor units showing impact craters identified with filled circles. Figure from Thomson et al. [2011].
Geologic mapping
Geologic mapping is the attempt to sort out how different parts of a surface are situated in space and related in time. I participated in pre-landing investigations of the Mars Science Laboratory rover’s site in Gale crater [e.g., Milliken et al., 2010; Thomson et al., 2011], and am currently working with colleagues on a USGS 1:60,000-scale geologic map of the western portion of Aeolis Mons, the central mound within Gale. I have also embarked on a Venus mapping project led by Nick Lang of Mercyhurst University to study Mahuea Tholus, an interesting volcano.
![Mars global topography overlain with proposed landing sites for the Mars 2020 rover (white diamonds), ExoMars rover (pink squares), and past landing sites (solid black circles). Insets depict site type examples; full details in Thomson and El-Baz [2014].](http://lunatic.utk.edu/wp-content/uploads/2017/10/04_mola_gridded_16ppd_custom_color_v4_200dpi-650x473-300x218.jpg)
Mars global topography overlain with proposed landing sites for the Mars 2020 rover (white diamonds), ExoMars rover (pink squares), and past landing sites (solid black circles). Insets depict site type examples; full details in Thomson and El-Baz [2014].
Landing site studies
I am also interested in the integration of orbital and surface data. In addition to studies of the MSL landing site, I also completed a reexamination of the geology of the Viking 2 landing site using the wealth of orbital data returned since that mission’s conclusion [Thomson and Schultz, 2007]. Together with Farouk El-Baz, we compared and contrasted the selection of the Apollo landing sites with the selection of landing sites on Mars today [Thomson and El-Baz, 2014].
Software development
Over the course of my research, I have developed numerous software tools to aid and enable various projects. Although I appreciate the power and ease of commercial software packages, I also like using open source software where once can “peek under the hood” to better understand how it operates. I have developed several software packages to detect aligned features in volcanic fields, notably shield fields on Venus [Thomson and Lang, 2013, 2014, 2016.; Lang and Thomson, 2013, 2014].